
Spotify Audience Segments: Which Listeners Actually Pay You
If only 6% of your Spotify audience counts as active listeners, you are probably reading the number wrong.
Most artists pull up the Segments tab, spot that tiny green slice, and feel sick. Then they close it and go back to refreshing monthly listeners. That tiny slice is the group that chose you, and it usually drives far more of your streams than its size suggests.
Spotify audience segments sort everyone who ever played your music into three groups, and each group tells you what your music has earned so far. A song that blew up on a playlist and a song with real fans can show the exact same monthly listener count. The Segments tab is where you find out which one you are holding.
Who this is for
This one is for artists who already have something going: music is out, you check your stats, and you want the next release to hit harder than the last. The reading is the same at 3,000 monthly listeners or 300,000.
New to the dashboard? Start with our Spotify for Artists guide, then come back once you have a few weeks of data.
What You’ll Learn
- What each of the three segments measures, and why the percentage fools so many artists
- What Spotify’s own numbers say a healthy audience looks like
- The three numbers in the tab that tell you if your last push worked
- What to do for each group of listeners
- How Spotify’s ad tools use these exact same segments
- A ten minute habit that keeps you honest month to month
The Three Spotify Audience Segments, in Plain English
Start with the biggest number on the page: your total audience. Every person who played your music in the last two years sits inside that number, from the fan with your song on repeat to the stranger who heard three seconds in a playlist and skipped. Spotify sorts all of them into three groups.
| Segment | What it means | What it tells you |
|---|---|---|
| Monthly active listeners | These people streamed your music on purpose in the last 28 days, from places like your artist profile, your release pages, their own library, or their own playlists | Your real listeners, right now. They picked you. |
| Previously active listeners | They used to be monthly active listeners, then went 28 days or more without playing you on purpose | Warm contacts. They liked you once and drifted away. |
| Programmed listeners | They only play you when Spotify picks you for them, through things like editorial playlists, Radio, Autoplay, or another person’s playlist. They have not played you on purpose in at least two years | They know a song. Most of them do not know you. |
Every play in your account has a source, and Spotify splits those sources into two types.
Active sources are places where somebody went looking for you. Your artist profile, your album pages, their own saved music, their own playlists, their queue.
Programmed sources are places where something else picked you. Editorial playlists, Radio, Autoplay, Discover Weekly, and playlists that other listeners made. Spotify lists every one of them in its doc on the source of streams.
An active play is a decision and a programmed play is a coincidence, even though both count as one stream.
Spotify splits your monthly active listeners into three smaller buckets:
- Super listeners: 15 or more streams on purpose in the last 28 days
- Moderate listeners: 3 to 14 streams on purpose
- Light listeners: 1 or 2 streams on purpose
Spotify calls this a fan funnel, and it works like one. Almost every super listener started as somebody who played you once and liked what they heard.
Where to find it: on the web, Audience then Segments. In the app, the Audience tab, then View all segments. Same numbers in both places.
Why Your Active Percentage Looks Worse Than It Is
We get a version of this screenshot in our inbox all the time: a huge programmed slice, a tiny active one, and an artist asking what they broke. Usually nothing.
Your total audience covers two years. Your share of streams covers 28 days.Say a playlist sent you a rush of new listeners last year. Every one of those people still sits in your two year pool, including the ones who heard one song once and never came back. They all count against your active percentage. The 28 day view only looks at what is happening now, which is why it usually tells a much better story.
A producer in a niche genre posted their numbers on Reddit: around 35,000 monthly listeners, only 6% active, yet close to half of their streams came from that small group. Read the 6% alone and it looks grim. Read it next to the streams and you see a real audience holding things up.
On the same forum, another artist had 3% active and 97% programmed, and that catalog fell apart the moment the algorithm stopped feeding it.
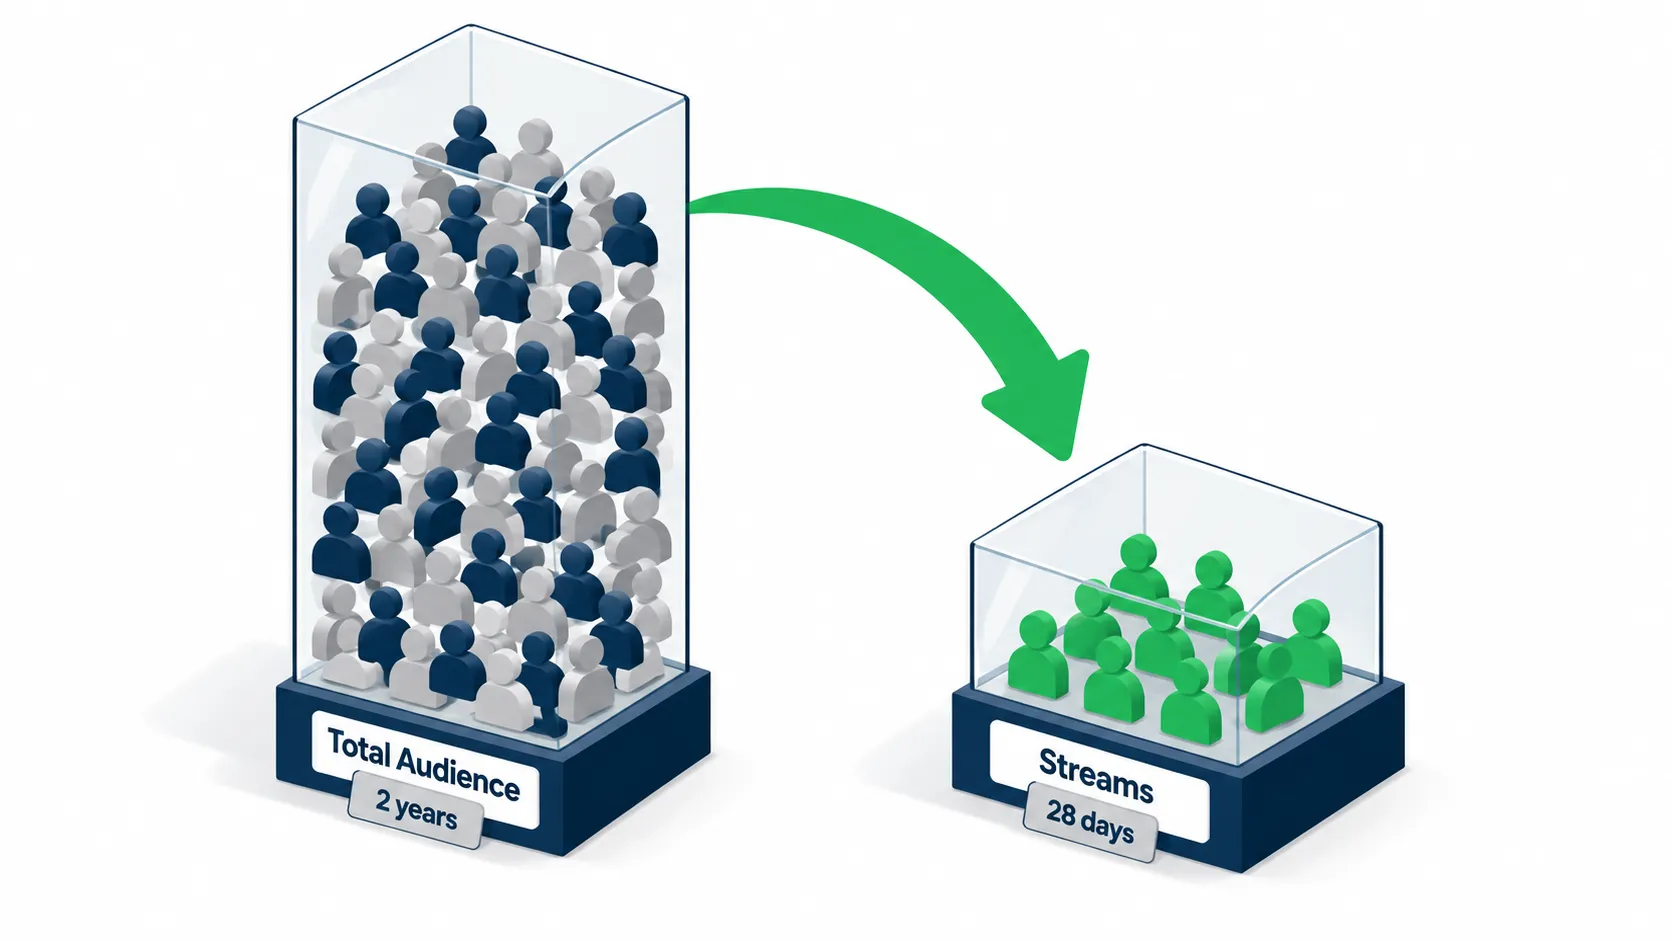
| View | Time window | The question it answers |
|---|---|---|
| Share of total audience | Unique listeners, two years | How deep is my relationship base? |
| Share of streams | Streams, last 28 days | Who is listening right now? |
Monthly listeners and monthly active listeners are also two different numbers, which confuses almost everyone. Monthly listeners counts everyone who played you in the last 28 days, playlists included. Monthly active listeners only counts the people who chose you themselves. If you want the full breakdown of that 28 day count, we wrote a whole guide on Spotify monthly listeners.
When you are growing fast, lean on the 28 day stream view. The two year view is for spotting trends, not for grading yourself on a Tuesday night.
Your active share can also improve when nothing changed, because old listeners age out of the two year pool and shrink the bottom of the math. When that happens, check the counts, not the ratio.
What Healthy Actually Looks Like
Spotify has published its own benchmarks, and they are better than most artists realize.
Monthly active listeners make up about 33% of an artist’s total audience on average. They drive around 60% of streams and roughly 80% of merch purchases made through Spotify. They also come back about four times more often over the next six months.
Those numbers come from Spotify’s own guide to audience segments. An average describes the middle of the pack, so treat it as a reference point.
What your mix should look like depends on how you got your listeners.
- If playlists built your audience, your active share of total audience will sit low, and under 20% is normal. Watch two numbers instead: your share of streams, where near half or better is strong, and your active count, which should climb month over month.
- If you built from social and direct fan work, an active share above 30% is realistic. Protect it like it pays rent, because it does.
- If your active share drops under 5% and programmed drives almost every stream, you are renting your playtime. One playlist change and most of it disappears.
Streaming subscriptions now bring in more than half of all recorded music revenue worldwide, according to the IFPI Global Music Report. Reach has never been cheaper, and the listeners who come back are what you build on.
Skip the “am I at 33%?” question. These three tell you more:
- Is my active listener count growing?
- Are active listeners still producing near half or more of my streams?
- Are my super listeners growing along with my total audience?
Three yeses means you are building something that can survive a bad month. If you cannot say yes to all three, the next section is for you.
The Number That Tells You Who Is Funding You
Two artists can show the same 30,000 monthly listeners and run completely different businesses. One audience pays your rent. The other disappears the moment a playlist rotates you out. The difference shows up in streams per listener.
Spotify tracks it for you. In Source of Streams, switch the metric to streams per listener, then read it next to saves and playlist adds to see how hard each group plays you.
What to look for:
- Active listeners at 3 or higher: you have a replay base. These people come back without being pushed.
- Active listeners near 1 or 2: people check in once and leave. Fix the song or the catalog, not the marketing.
- Programmed listeners near 1: normal. They heard a track in a playlist and kept moving.
Run the multiplication to see what each group is worth. Say you have 900 active listeners at 3.2 plays each. That works out to 2,880 streams from people who chose you. Your programmed group might be 9,000 people at 1.4 plays each, which adds up to 12,600 streams.
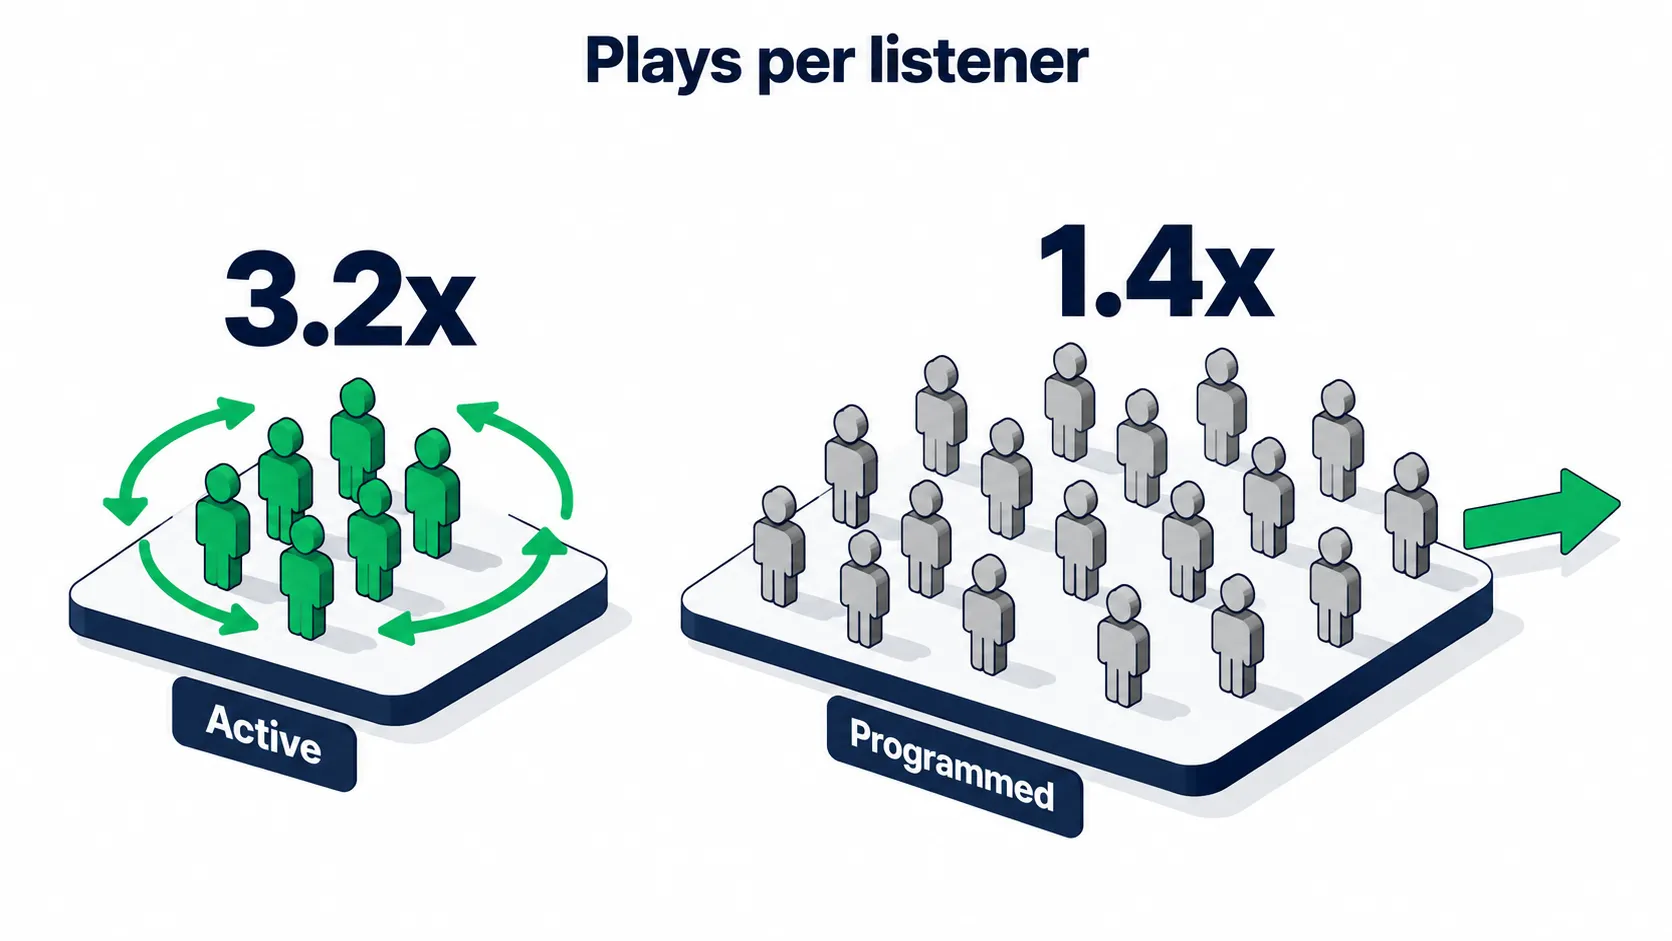
The programmed group wins on volume, but the active group wins on everything that adds up over time.
- Programmed streams stop. The moment a playlist rotates you out, that traffic is gone.
- Active streams keep going. These are people with your song saved in their own library.
- Active listeners spend. Spotify reports they drive around 80% of merch purchases made on the platform.
- Active listeners signal. Spotify’s guide to how fans find music says recommendations run on listener signals. Those signals are what turn into future active streams.
When a campaign report lands in front of you, ask two questions: how many new active listeners did it create, and what happened to streams per listener?
When Your Mix Looks Off
You do not need a consultant to figure out most segment problems. Match what you see in the tab to a likely cause, then make the first move.
| What you are seeing | What it usually means | What to do first |
|---|---|---|
| Active share under 5% and falling | Your growth is rented from playlists | Earn a save at first listen, then ask those listeners again on your next release |
| Programmed is over 90% of your streams | People hear you, but nobody is choosing you | Profile and playlist work, plus a campaign built to grow your audience |
| Previously active is bigger than active | You went quiet between releases | Fix your release rhythm, then run a win back on the people who already liked you |
| Active share is healthy but the total audience is flat | You keep serving the same people | Go find new ears with collabs, features, and cold reach |
| Everything spiked after one push, then faded | You got a moment, not a habit | Turn that moment into saves, follows, and a reason to come back |
Plenty of scary looking numbers are noise. Some are early warnings, and sorting one from the other takes two minutes.
| Looks worrying | Why it is usually fine |
|---|---|
| Active share dropped while your total audience grew | You added more strangers than fans, so the percentage fell while the count climbed. Read the count. |
| Programmed listeners dominate your audience | Normal when playlists and algorithms built you. Watch the share of streams and the conversion rate instead of the size of the passive pool. |
| Super listeners look like a sliver | They always do. Most active listeners sit in the light and moderate buckets, and that small group still drives merch and tickets. |
The opposite also happens. These numbers look healthy while a problem grows underneath them.
| Looks healthy | What is actually happening |
|---|---|
| Total audience keeps climbing | If the active count is flat, you are collecting strangers from playlists. |
| Share of streams from active looks strong | Check the count behind it. A shrinking active group with a healthy percentage is still a shrinking core. |
| Monthly listeners went up | Compare saves and follows per 1,000 streams. Rising plays with falling saves means more people hear you and fewer stick. |
Two rules keep you honest. Percentages lie when the numbers are small, so under 500 listeners in a segment, judge the count. And because the window is 28 days and reporting lags, give a trend three straight weeks before you believe it.
The Three Numbers That Show If Your Last Push Worked
Besides the slices, the Segments tab shows how listeners moved between groups over the last 28 days. That movement is the clearest proof of whether a promotion worked.
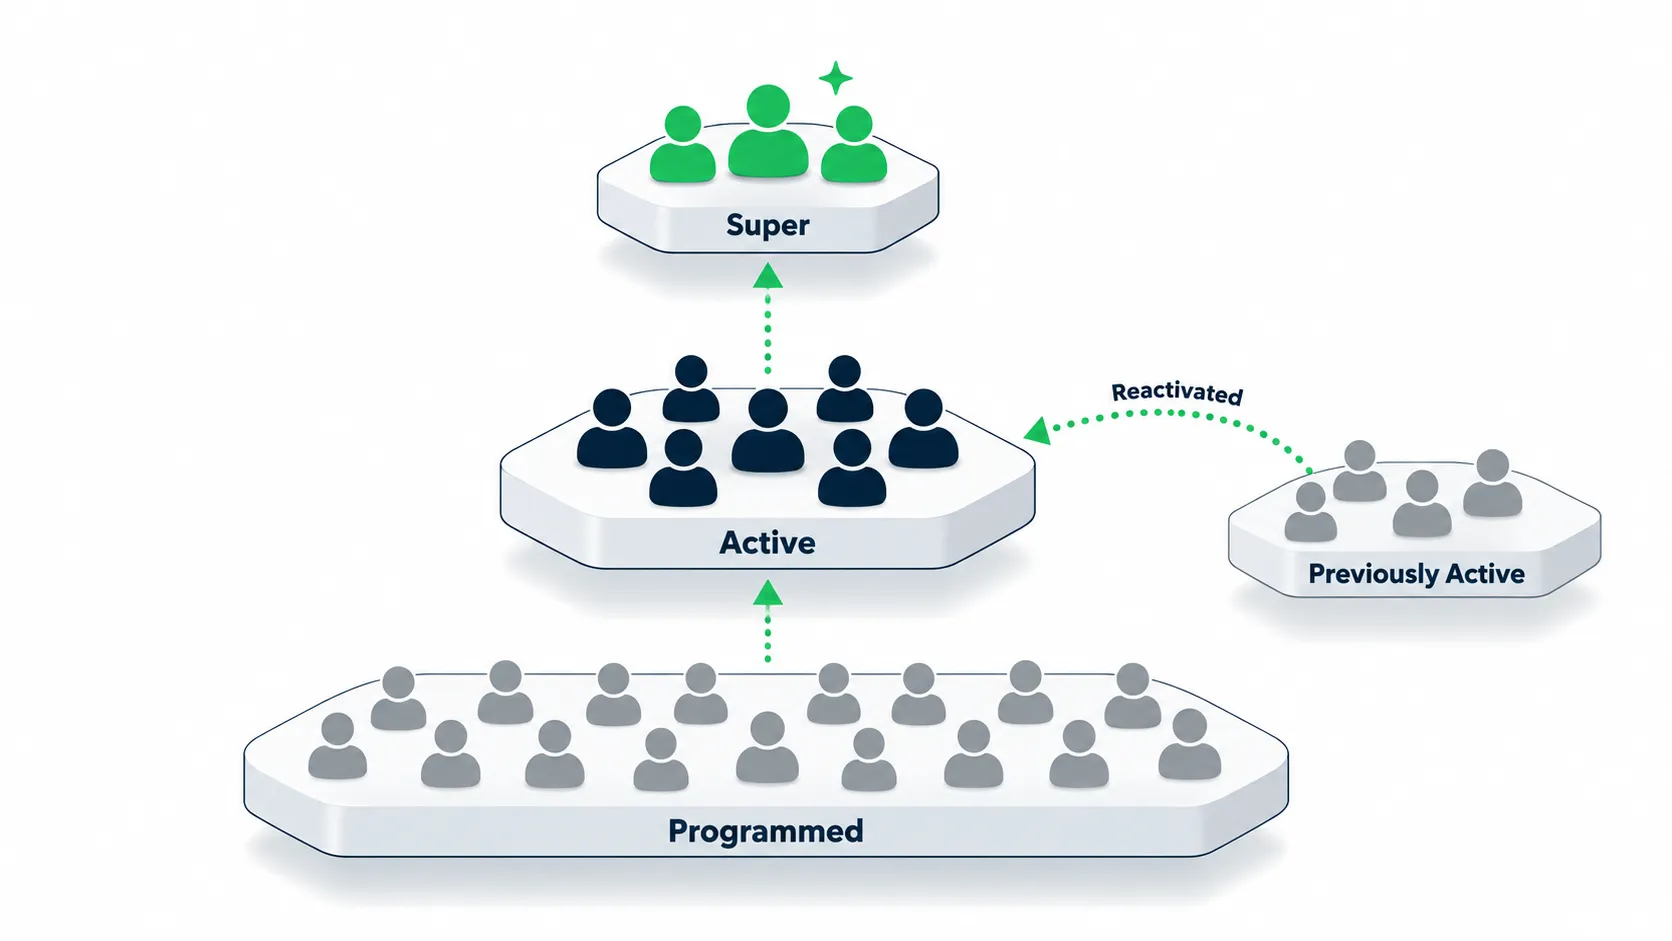
| Movement | What it means | Why it matters |
|---|---|---|
| New listeners | Played you for the first time anywhere on Spotify | Your reach grew past your usual crowd |
| New active listeners | Joined your active group, often coming from programmed sources | A passive listener chose you. This is the conversion that counts. |
| Reactivated listeners | Came back into your active group after time away | Your win back worked, usually for less than cold reach would cost |
Read them as a set, because almost any push can move one of them. If a campaign only adds plays, you will see new listeners and programmed growth. If it earns saves, follows, and repeat plays, new active and reactivated listeners will climb. Your monthly listener count cannot tell those two apart, but these three lines can.
The ratio we track on every campaign
Divide new active listeners by new listeners and you get a conversion rate.
Say 4,000 people heard you for the first time last month and 320 of them joined your active group. You converted 8%.
That number beats a stream count because it tells you where the problem is. High reach with low conversion means the traffic is landing somewhere that gives people no reason to stay. Low reach with high conversion means the song works and more attention would pay off.
Track it release by release. It is the closest thing to a scoreboard the platform gives you.
Then let the ratio steer the money. When you reach people through different listener groups, the group that turns programmed listeners into active ones gets the next dollar, and the group that only adds plays gets cut. Read every number in your own Spotify for Artists, and carry the winning group into your next release so it starts warmer. That cycle is what we call the audience intelligence loop.
Try it small. Build one small ad audience around each of 2 or 3 similar artists and point it at your profile or This Is playlist. Run each group in its own week so your movement numbers can tell them apart. After 7 days per group, write down new listeners, new active listeners, saves, and follows, then put the next week’s budget on the group with the best ratio. Doing this at scale means many audience pockets running at once, budget shifted daily, and tracks rotated inside each pocket.
Want the deeper measurement framework? Our guide to music analytics covers lift, listener quality, and carryover without turning it into a data project.
What to Do for Each Group
Monthly active listeners: keep them close
These people already chose you. Give them a reason to choose you again.
- Release on a rhythm they can predict. Long silences are how active listeners turn into previously active listeners.
- Give them a home. Build a This Is playlist and send your ads, posts, and stories there.
- Push them up a rung. Super listeners play you 15 or more times in 28 days. No marketing trick makes someone replay a song they only kind of like.
- Treat them like customers. This is the group most likely to buy merch, vinyl, and tickets. Our super listeners guide is entirely about the people at the top of this group.
Previously active listeners: go win them back
- They already liked something. Lead with the sound they came for. Save the experiment for later.
- Use the tool built for this. Spotify’s “Reactivate” audience goal exists for exactly this group.
- Reach them off platform too. Your email list, retargeting, and creator collabs can all point to the song they used to play.
- Mind the cost. Winning back someone who knows you is usually cheaper than finding a stranger. The reactivated line will tell you if it worked.
Programmed listeners: turn attention into a choice
- Know the pool. Spotify keeps a separate group called potential listeners. These people have not played you in two years or more, but their habits say they might like you.
- Win the first contact. A save, a follow, or an add to their own playlist is the moment someone stops being a stranger. We treat saves as the first real fan signal.
- Make the ask stupidly easy. Pin your best track. Clean up your profile. Build a playlist that shows your range. Then ask for the save at shows and in your videos.
- Avoid the shortcut. Playlist traffic alone does not build this group, and neither does paid traffic that never reaches your profile. Spotify even has a page warning about third party services that guarantee streams. That tells you how the platform feels about bought plays.
Most artists learn this one the expensive way. A playlist add that never touches your profile pumps the programmed number and leaves the active number alone. So check where a push’s plays landed and whether anyone came back.
To see how expensive that lesson gets, read the story of a promotion mistake that cost $1,400. Better to learn it from someone else’s invoice.
Which Channels Build Which Segment
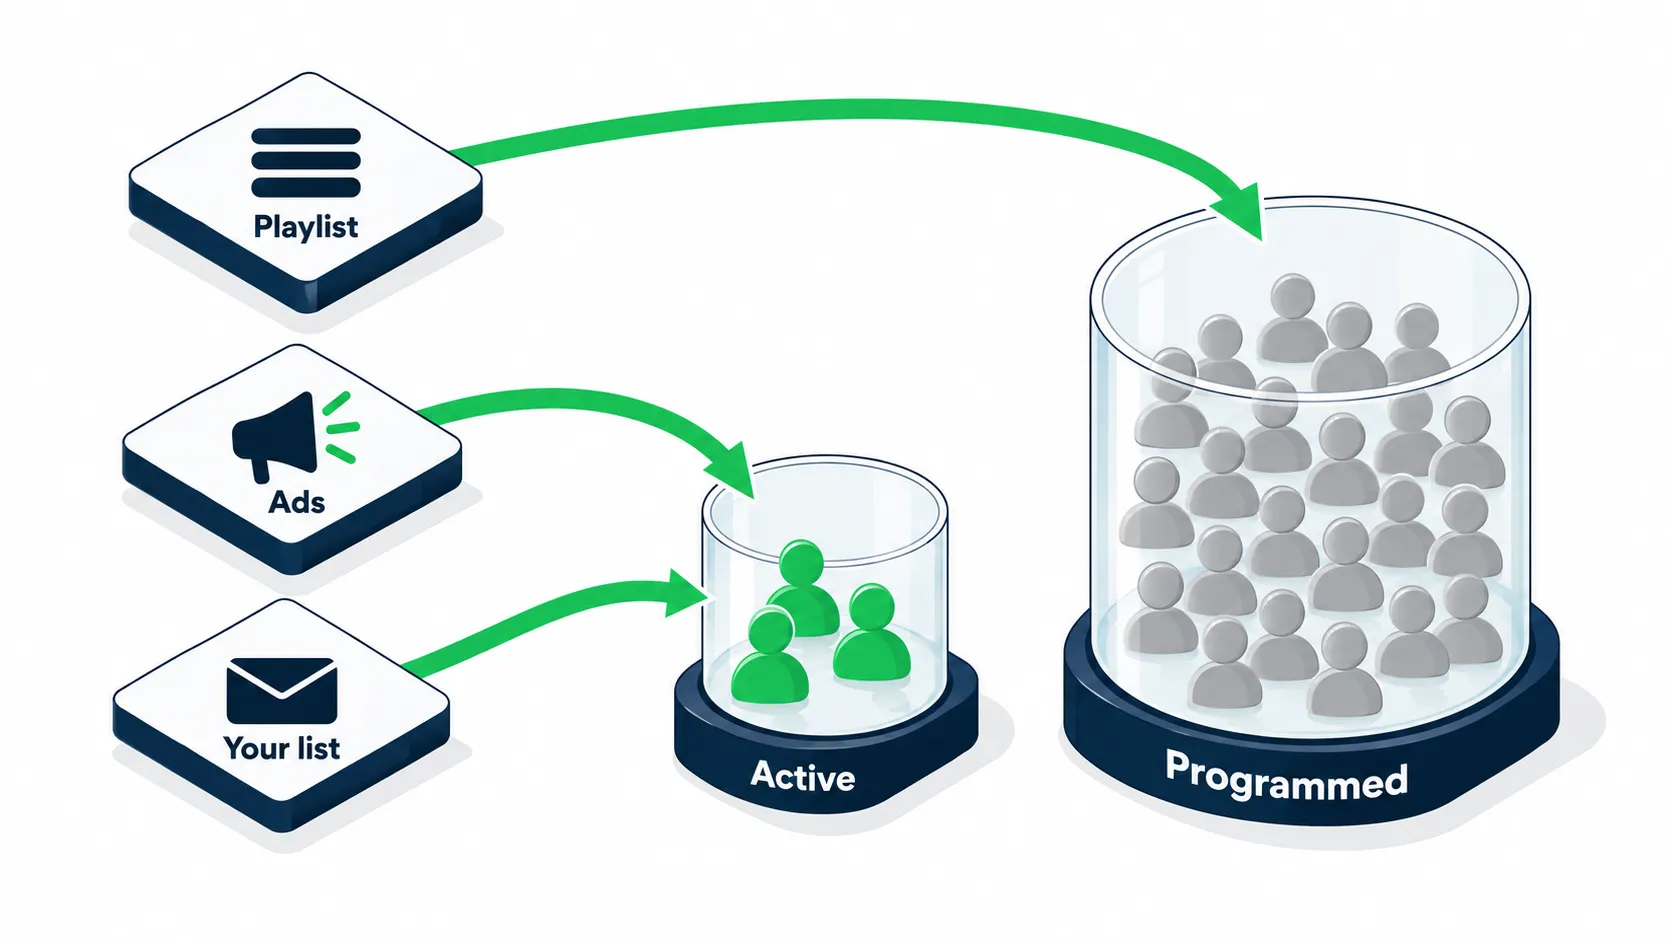
Channels build different audiences. Some hand you listeners who forget you by Friday, others a smaller group who stick around.
| Channel | What it usually builds | What to watch |
|---|---|---|
| Playlist placement, curator or paid | Mostly programmed listeners | Profile visits and saves per 1,000 streams |
| Editorial playlist pitch | Programmed listeners, plus credibility that helps your next pitch | New listeners and saves, not just streams |
| Ads pointed at the song page | New listeners, with a wide range of quality | Save rate and cost per save |
| Ads pointed at your profile or This Is playlist | More active listeners per dollar, fewer total clicks | New active listeners |
| Marquee and Showcase | Depends on the audience goal you pick | New active and reactivated listeners |
| TikTok and short clips | New listeners, usually in bursts | Follows, saves, and how many stick past week one |
| Email and SMS to your own list | Active listeners almost every time | Repeat plays in the first 48 hours |
| Collabs and features | New listeners plus the other artist’s audience | Which side of the collab converts better |
| Press and blog coverage | Low volume, high intent readers | Name searches and profile visits after it runs |
Playlist traffic is a reach tool and rarely a fan tool. If a channel cannot send people to your profile and earn a save, it grows the programmed number and leaves your active number where it was.
Pick the listener type first and let it decide the channel, the creative, and the landing page. Budget comes last. Flip the order and you get a spike that fades in nine days.
How to Judge Any Promotion, Including Ours
Promotion is what we do for a living, and this is the standard we build every campaign against. It works as a filter for any service you are weighing.
Most artists open with “how many streams will I get,” and that question leads straight to the same fading spike. Ask these five questions instead.
- What kind of listener does this produce? Playlist placements build programmed listeners. Profile traffic builds active ones. A partner who cannot answer this is selling inventory, not results.
- Where does the traffic land? A song page earns a play. A profile, a This Is playlist, or a follow earns a relationship.
- Which numbers will you report? New listeners, new active listeners, saves per 1,000 streams, and whether the lift held past week one. If the report is a screenshot of a stream count, it proves delivery and nothing else.
- How are placements chosen, and can I see them? Vetted, genre matched placements behave nothing like a bulk list. If someone promises a specific editorial playlist, walk away. Spotify owns those and nobody sells them.
- What happens when the campaign ends? A real partner points you back at your own segment movement. Anyone who promises a specific outcome is guessing, or lying.
The green flags are boring and specific. The partner asks about your catalog. They ask which of your songs fit and test more than one. They tell you when a track is not ready. The red flags are loud and vague: guaranteed streams and reports that never mention saves.
Inventory is easy to buy anywhere. Fit is harder to find, and fit is what you are paying for. A good partner will show you two things if you ask: how one song gets matched to one listener type, and how each placement was vetted.
Two more criteria finish the list. Good Spotify promotion moves budget toward the listeners who save, follow, and come back, and every result shows up in your own Spotify for Artists. Good playlist work should let you pick the exact playlist before you pay and vet every curator before a pitch goes out.
Timing Your Moves Around a Release
Everything in that tab runs on the same 28 day clock, and your segments update on a delay. Ignore the delay and you will spend money on the wrong week.
| When | What to do | What to watch |
|---|---|---|
| Three to four weeks before | Warm up your active listeners, collect pre-saves, pitch editorial, and line up the content that sends people to your profile | Active count and super listener share |
| Release week | Run the push. Marquee only works within 21 days of release and runs about 10 days. Showcase can run anytime and lasts about 14 days | New active listeners |
| Weeks two to four | Keep feeding the song that is working and cut what is not | Reactivated listeners and share of streams |
| After day 28 | Review your segment mix, then decide what the next release needs | Active growth month over month |
Our pre-release strategy covers the weeks before. The music release checklist handles the days after. If you want the whole sequence from pitch to playlist, the Spotify algorithm launch playbook walks through it step by step.
What to Do When the Algorithm Hands You a Spike
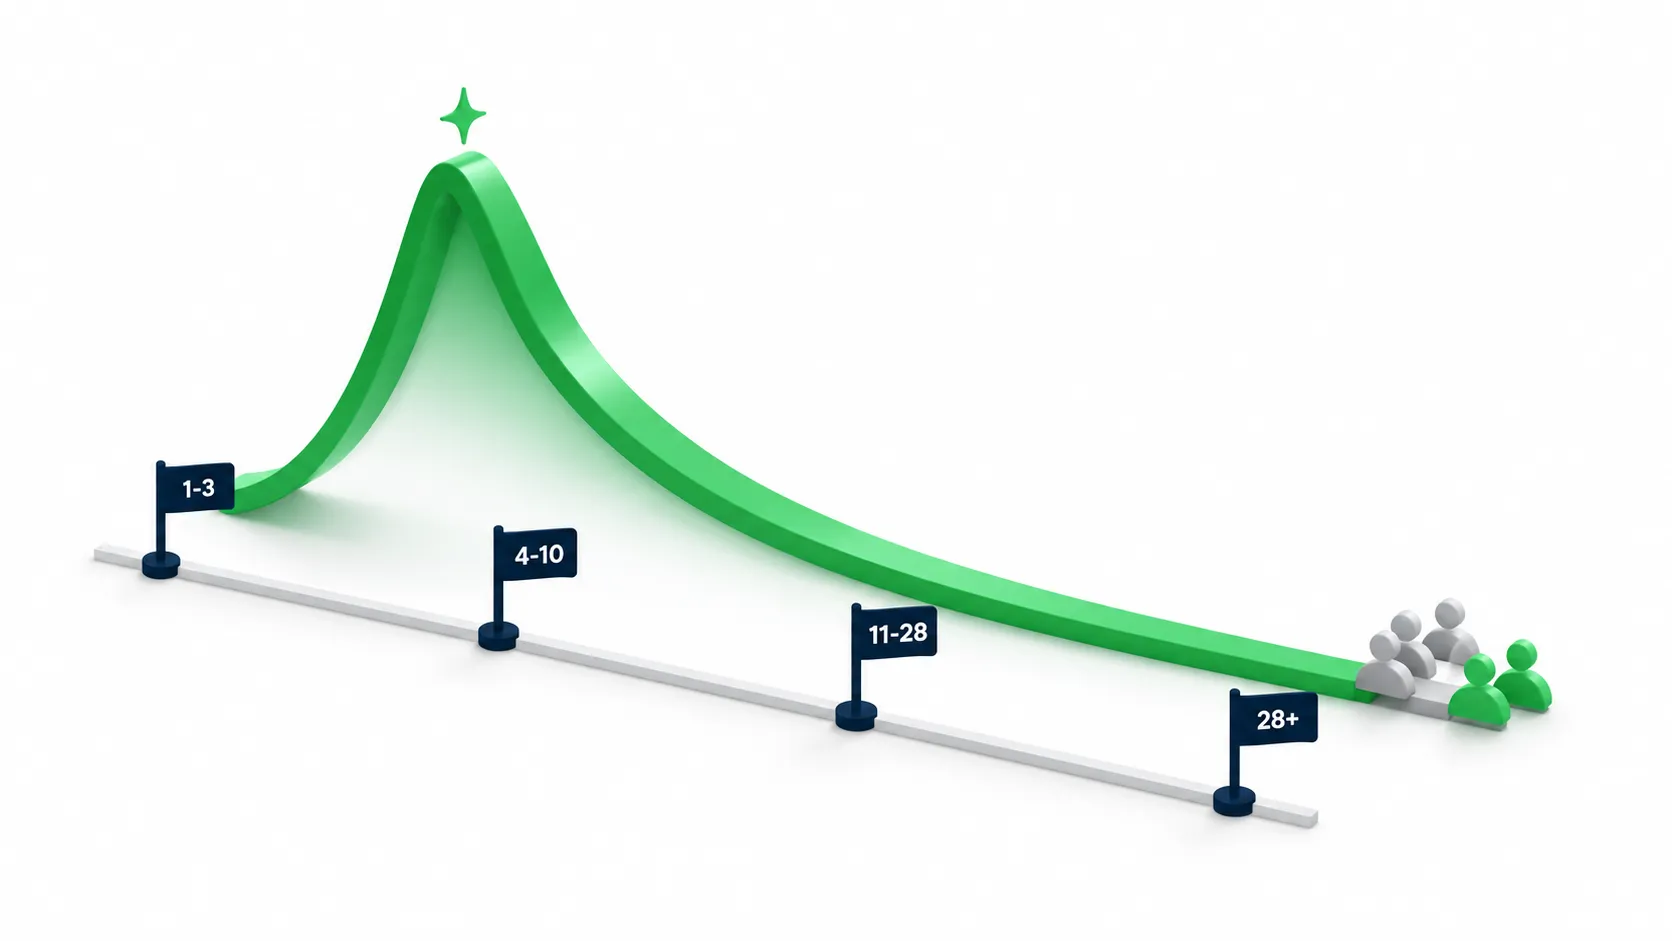
Every artist gets a window where the algorithm pushes a song at strangers. It might come from Discover Weekly, Radio, a playlist add, or a clip that takes off. The window lasts days, not months, and what you do inside it decides how many of those strangers stay.
Days 1 to 3. Have the shop window ready before the spike, not during it. Pinned track, artist pick, clean bio, Canvas live, and a playlist that gives a new listener somewhere to go next.
Days 4 to 10. Give those new listeners a reason to return. Post the proof and tell your email list. Then point a small budget at your profile or your This Is playlist instead of the song page, because that is where a play can turn into a relationship.
Days 11 to 28. Run the ratio. New active listeners divided by new listeners tells you whether the spike is turning into a base.
After day 28. Whatever you did not convert slides into previously active. Previously active listeners are the cheapest audience you will ever retarget, and your next release is the moment to reach them.
You cannot control when the algorithm tests you, so the profile and playlist work has to happen before you need it. When the conversion rate is low, the fix is usually the song or the landing spot, not more reach.
The Same Segments Are Inside Spotify’s Ads
The targeting inside Spotify’s ad tools probably looks familiar, because Spotify built it around these exact segments. You pick an audience goal during setup, and each goal maps to one of the groups above.
| Audience goal | Who you can target |
|---|---|
| Grow audience | Programmed listeners and potential listeners, plus a collaborator’s audience on joint releases |
| Deepen fan engagement | Monthly active listeners, or a slice of them: super, moderate, or light |
| Reactivate | Previously active listeners |
Before you spend, know the limits. You need at least 1,000 streams in the last 28 days in a target market to run a display campaign. Marquee wants at least 5,000 monthly active listeners in that market. Spotify explains the formats in its guide to display campaigns. The targeting options live in its guide to audience goals.
Setting your segments by hand beats letting Spotify choose, because automatic targeting can narrow the campaign more than you would expect. And potential listeners cost more per click, though they often convert better when the song fits them.
Sizing your first test? Our music promotion budget calculator helps you pick a number you can learn from.
A Ten Minute Habit for the First of Every Month
Set a reminder, open the Segments tab, and do five things.
- Write down three numbers: active listeners, share of streams, and super listeners.
- Check movement for the last 28 days, especially new active and reactivated listeners.
- List everything that ran in that window. Releases, ads, content, collabs, playlist pushes.
- Compare the two lists. What moved your numbers gets more budget. What did not gets cut.
- Pick one action per group: something to reward the active, something to reach the previously active, something to convert the programmed.
A note on your phone is fine. If you want a table, here is the one we use.
| Month | Active listeners | Share of streams | Super listeners | What ran | What changed |
|---|---|---|---|---|---|
| Month 1 | |||||
| Month 2 | |||||
| Month 3 |
Not sure what your own mix is telling you? Run the free Spotify audit and get a read on your numbers before you spend another dollar.
Key takeaway
Frequently Asked Questions
What is a normal ratio between active and programmed listeners?
It depends on how you built your audience, and anyone who hands you a single number is guessing. Playlist heavy catalogs run mostly programmed. Artists with strong social and follower traffic can hold active share above 30%. Direction matters more than the ratio: you are in good shape when your active count is growing, active listeners still bring in near half your streams, and new active listeners show up after each push. A catalog at 3% active and 97% programmed is fragile no matter what the monthly listener number says.
Is Spotify’s 33% active listener average actually real?
Yes, and it comes straight from Spotify. Keep two things in mind. The figure is an average across all artists, and it compares monthly active listeners to a two year audience pool. If you grew fast from playlists, that pool is packed with one time listeners who drag your percentage down. Compare yourself to your own trend first. Treat the platform average as a reference, not a grade.
How do I increase my monthly active listeners?
Give people a real chance to choose you. Profile visits, saves, follows, and adds to their own playlists all build this group. Pre-saves help for that exact reason. So do direct messages to your list and keeping a song alive past release week, instead of jumping to the next one. Then check your movement numbers. New active and reactivated listeners are the proof the work landed. If those stay flat, the problem is usually where your traffic came from, not how much you spent.
Can programmed listeners become active listeners?
All the time. Spotify’s movement numbers track new active listeners arriving from programmed sources and from outside your audience. The switch usually flips on a save, a follow, or a repeat play. The first few seconds of your song are where that choice gets made. A clean profile with one clear next step beats a clever caption every time.
Do Marquee and Showcase campaigns hurt my algorithmic reach?
No. There is no evidence that paid placements suppress your reach. They are labeled promotions, shown to people Spotify thinks will like the song. What moves your reach is how listeners respond: saves, skips, and replays. If a campaign flops, that response is the reason, not the ad itself. If a campaign spends slowly, check your eligible audience and your segment settings before blaming the algorithm.