
Spotify Algorithmic Streams Dropped? Know What to Fix First
Before you spend more to replace lost Spotify streams, find out which part of your growth stopped working.
When your Spotify algorithmic streams drop, check which sources held up. If Radio falls but people still choose your songs, you have a different problem from a catalog losing both reach and repeat plays.
The decision behind the drop
You need to separate three things: the traffic you lost, the demand that remains, and the results your next dollar can buy. Otherwise, you can spend a week changing ads that still work, or spend more to cover a problem you have not found.
Keep Spotify for Artists open as you work through the checks.
What You’ll Learn
- How to measure the loss against a fair baseline
- How to narrow the cause using tracks, sources, countries, and dates
- Why steady saves or active streams can give false comfort
- How to judge paid promotion while algorithmic reach is down
- What evidence warrants support, and what counts as recovery
Why did your Spotify algorithmic streams drop?
Start with the event closest to the first low day: a release aging out of Release Radar, a campaign ending, a distributor move, or a reporting delay. Then check whether that event explains the size and spread of the loss.
A 300-stream loss from Release Radar cannot explain 3,000 missing plays. A campaign change on one song is a weak explanation for ten older songs losing the same source that day.
If no event fits, mark the cause as unknown. You can still decide what to spend while you investigate.
If only your public audience count fell, use the Spotify monthly listeners guide.
1. Measure the drop against a fair baseline
Spotify says artist stats update daily and use UTC days. Exclude days still waiting for a full update. Keep the same songs, country filters, and metric in both views.
Use two comparisons. Compare the last full week with the week before it to measure the recent loss. Then compare with your normal range before the launch or campaign peak.
For a steady catalog song, take the last four unaffected Mondays. Sort the stream counts and average the middle two for a rough reference. Do the same for each weekday. This keeps one huge day from setting the whole baseline. It is a working check, not a statistical test.
For a new release, use days since release. Comparing its launch Friday with a quiet Friday a month later mixes age with performance. A past release can help, but note differences in spend, follower base, and placements.
If the drop started three days ago, compare those complete weekdays now. You do not need to wait a week to check a missing release or campaign gap.
Save a dated record before making changes:
| Keep fixed | Record beside it |
|---|---|
| Track and Spotify link | Release age and any replacement upload |
| Dates, UTC, and country filter | First low day and last normal day |
| Source label and stream count | Ad spend, campaign status, placement dates |
| Earlier comparison period | Any unusual spike that makes it a poor baseline |
Recheck the same dates after the next update. If older numbers fill in, part of the apparent loss was reporting. If they stay low and the following days fall too, investigate the drop.
2. Find which source explains the drop
Open the Audience, Song, or Release overview in Spotify for Artists. Choose Segmentation, then Source of Streams. Spotify’s source of streams guide explains the available breakdowns and filters.
Focus on Personalized playlists, autoplay, and mixes for algorithmic traffic. This includes sources such as Radio, Release Radar, and Discover Weekly.
The broader programmed category also includes editorial playlists and other listeners’ playlists. A loss there is not automatically an algorithmic loss.
Open the playlist details to see which named source lost plays. If the view groups sources, keep that label. A combined total cannot tell you how much came from Radio alone.
A missing playlist row does not prove removal. Spotify shows the top 100 playlists and requires at least three listeners for a playlist to appear. Check the source counts before treating a missing row as lost placement.
Work out where the missing plays came from
This illustrative example compares two full weeks:
| Stream source | Before | After | Streams lost |
|---|---|---|---|
| Algorithmic sources | 7,000 | 2,500 | 4,500 |
| Active sources | 2,000 | 1,900 | 100 |
| Other sources | 1,000 | 600 | 400 |
| Total | 10,000 | 5,000 | 5,000 |
Total streams fell 50%. But algorithmic traffic explains 4,500 of the 5,000 lost streams, or 90% of the net drop.
Active streams fell 5%. Check the lost recommendations first, then ask whether existing fans held steady or paid traffic replaced some of their plays.
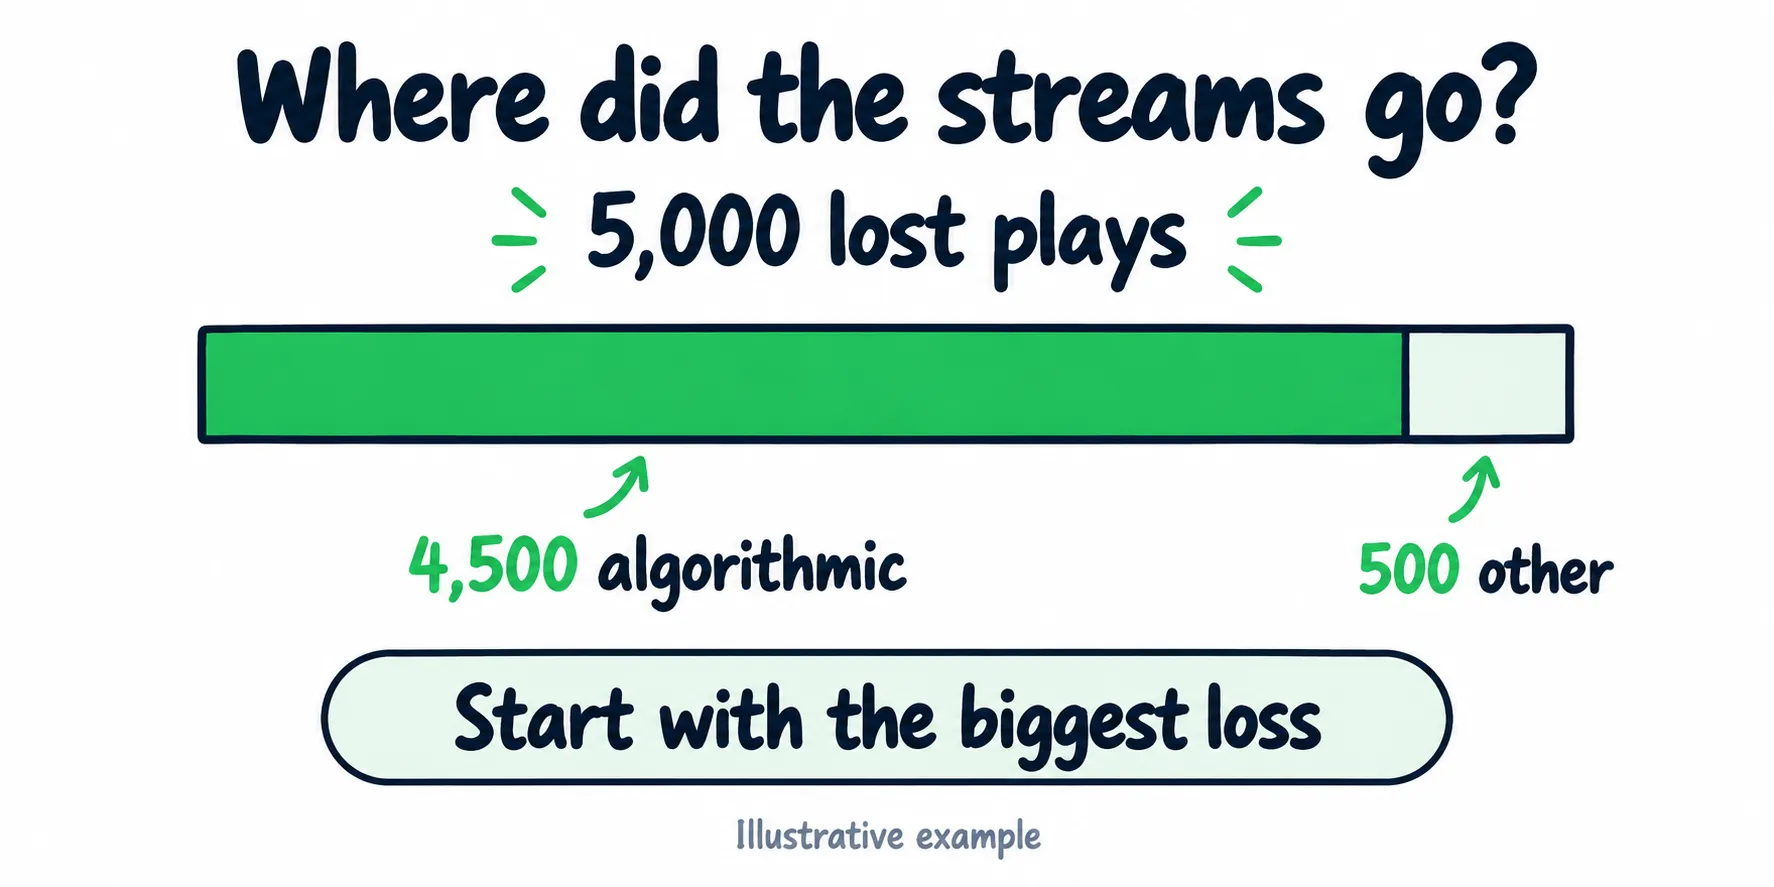
In this example, algorithmic sources account for 90% of the lost plays.
Use this math for your own numbers:
Source loss = source streams before minus source streams after.
Share of the net drop = source loss divided by total stream loss, multiplied by 100.
One source can account for more than 100% of the overall drop if another source grew. For example, losing 1,000 Radio plays while gaining 200 library plays leaves you down 800 overall. If total streams did not fall, skip this percentage and compare the source counts.
Watch for misleading percentages
Suppose algorithmic traffic stays at 2,000 streams while total streams grow from 4,000 to 8,000. Its share falls from 50% to 25%, even though no algorithmic streams were lost.
Read the count beside the percentage. And watch for double counting: Radio plays in your campaign report may already be part of the total in Source of Streams. Adding the two could count the same plays twice.
For more on how Radio, Mixes, and the other sources differ, use the algorithmic playlists guide.
3. Use your catalog to test the likely cause
Build a small comparison set: the song that fell, two older tracks with steady history, and a track outside the current campaign. Compare the same dates and sources, then narrow by country where the report allows it.
Pick tracks with enough prior traffic to show a change. A song that went from two Radio plays to zero adds little evidence to a catalog losing thousands.
Look for what the affected tracks share
| What fell | Stronger lead to check | Evidence that weakens that explanation |
|---|---|---|
| One recent release loses Release Radar | Release age and playlist history | Older tracks lose Radio on the same day |
| Only tracks in one campaign lose Radio or Mixes | Enrollment, delivery, or audience changes | Tracks outside that campaign show the same loss |
| Old and new songs lose the same source together | A shared account, campaign, reporting, or delivery event | The fall is spread across different dates |
| Most of the loss comes from one country | Country targeting, delivery, or source changes there | Comparable losses appear across several markets |
For each possible cause, write what you would expect to see if it were true. Then check a track or country that should behave differently.
Suppose you blame a distributor move. Did every moved track fall? Did tracks left with the old distributor hold up? Did only songs with Discovery Mode lose traffic?
Check the dates in the right order
If ad delivery fell on Monday and Radio fell on Thursday, the campaign change is worth testing. If Radio fell Monday and you cut spend Thursday, that cut cannot explain the initial drop. It may affect what happens next.
Do not call your unpromoted track a clean control. Listeners can hear one advertised song and explore the rest of your catalog. Use it as a comparison, and note any shared release or playlist activity.
Your notes might read: “Four older songs lost Radio on Tuesday in several countries. Spend stayed level. Two songs outside Discovery Mode fell too.” That weakens a campaign enrollment explanation and gives support a clear pattern to check.
4. Match the drop to release and campaign dates
Put the first affected date beside your release dates, ad changes, playlist placements, Discovery Mode campaigns, and distributor moves.
Release Radar fell after the launch
Spotify can include a song in Release Radar for up to four weeks if a listener has not heard it. That does not mean every artist gets four weeks of equal traffic.
Check how many lost plays came from that playlist. If Release Radar accounts for most of it and older songs hold steady, focus on the next source of discovery. If Radio and Mixes fell too, keep investigating those separately.
Use the Release Radar guide to check the timing and rules for your release.
Promotion stopped or changed
A campaign can still say “active” while spending less or reaching a different audience. Check the daily spend, countries, songs, and clicks around the day your streams fell.
Compare before, during, and after promotion. Say you had 500 streams a week, reached 2,000 during a push, then settled at 900. You lost the peak, but you are still getting 400 more weekly plays than before.
Keep other releases and promotions beside those dates. They may explain some of those extra plays too.
Discovery Mode or your distributor changed
Spotify lists Radio, Autoplay, and certain Mixes as Discovery Mode contexts. Ask whoever manages it whether the songs that fell were still in the campaign on those dates.
If you moved distributors, ask both teams to confirm which songs were selected and when each campaign ran. Check for a gap between them.
Read the Discovery Mode report by song, not just by campaign total. A strong catalog track can hide a sharp fall on the song you are trying to diagnose.
Keep its two lift measures separate:
- Campaign lift estimates the current campaign’s effect against modeled streams without Discovery Mode.
- Historical lift compares with the 28 days before that song’s first campaign.
You can be above an old baseline while losing ground this month. Neither measure means every stream in Radio was caused by the campaign.
When you compare saves or intent rate across periods, give each period the same follow-up time. Spotify counts those actions for 14 days after each listener’s first campaign exposure. Newer results may still be filling in.
If the release itself changed, check the old and new track links. Spotify’s reupload guidance explains how track linking can preserve play counts when the audio and metadata match. Seeing your old play count on the new upload does not tell you whether Discovery Mode carried over.
5. Your save rate looks good. So why are streams falling?
You can have a strong save rate and still lose Radio plays. The rate describes the response among people who heard the song. It cannot tell you how many people Spotify will recommend it to next.
Spotify explains that recommendations draw on listener behavior, taste, and content information. Spotify does not give artists a save rate to hit that promises a set number of streams.
This second illustrative example uses saves divided by listeners for the same song and dates:
| Period | Listeners | Saves | Saves divided by listeners |
|---|---|---|---|
| Before the drop | 1,000 | 200 | 20% |
| After the drop | 200 | 60 | 30% |
Your rate went up from 20% to 30%, but the song reached 800 fewer listeners and got 140 fewer saves. Broad discovery may have shrunk, leaving a larger share of fans who already like the track. The higher rate alone does not show that new listeners responded better.
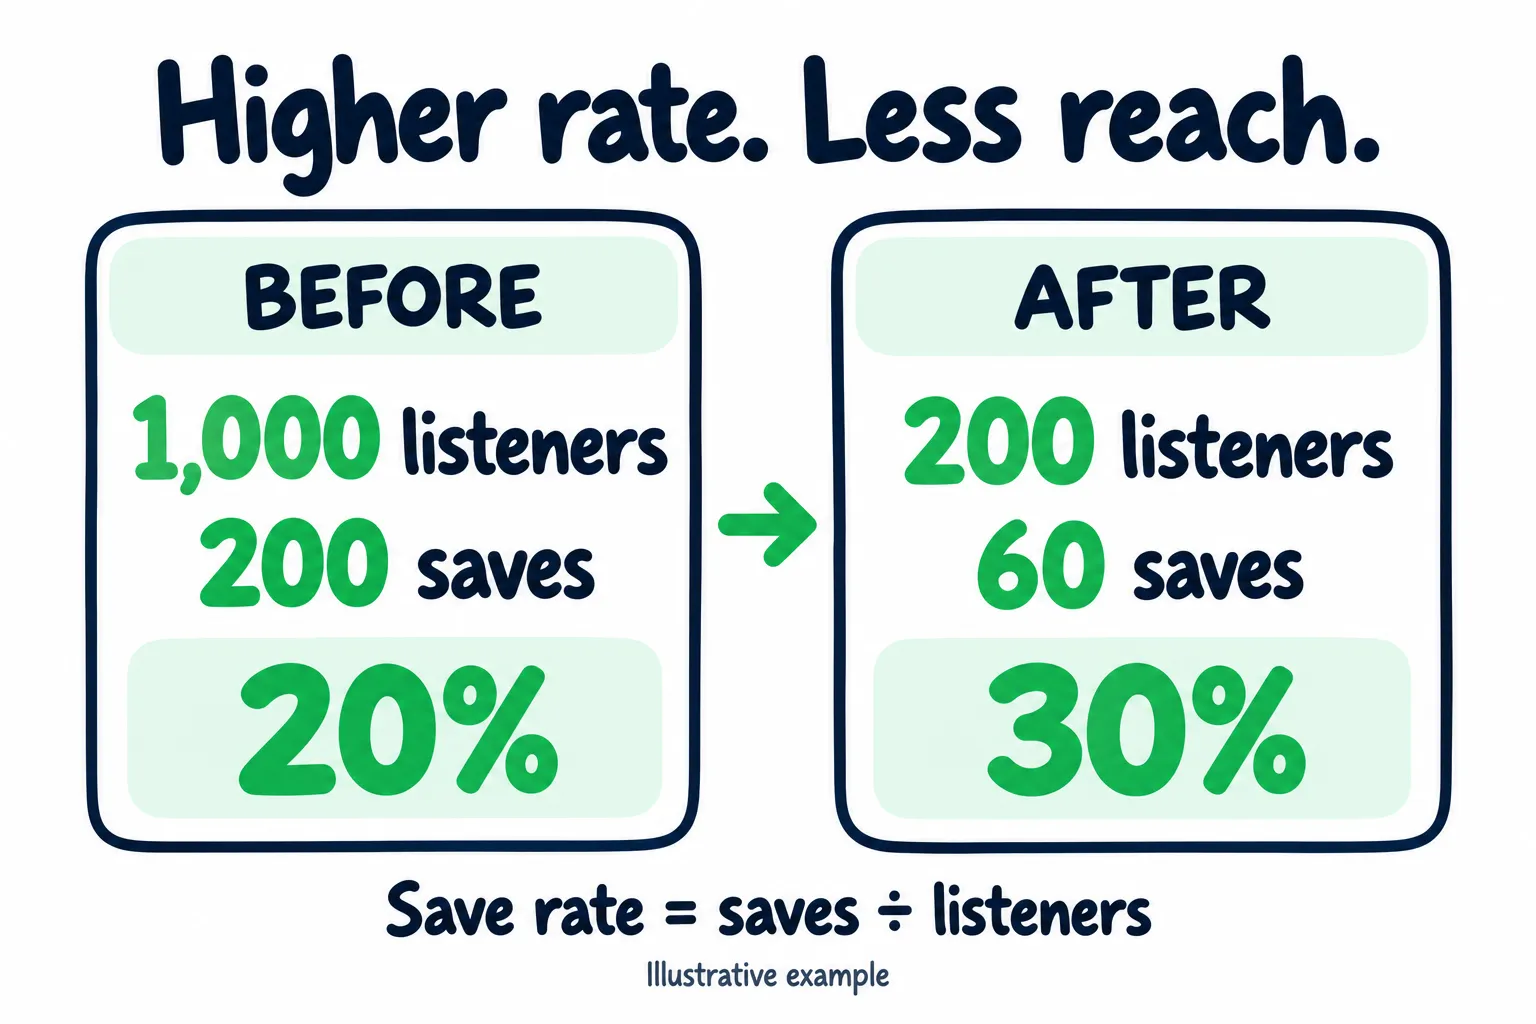
A higher save ratio can sit beside fewer listeners and fewer total saves.
Keep saves, listeners, and active streams beside the percentage. Dividing the totals does not tell you which new listener went on to save.
Use the same dates for both counts. Keep campaign reports separate when they use different definitions. The Spotify saves guide covers those details.
Check whether the audience changed
Check what changed behind the rate:
- Did new reach fall while the people who already know you kept listening? Check listener counts beside source changes.
- Did a different country or track take a larger share? Your blended rate can move because the mix changed.
- Did saves fall before the lost reach, or after it? Fewer saves after fewer listeners arrived may be an effect of the drop.
Use breakdowns the reports provide. If you cannot split saves by Radio audience, leave that result unknown. Total saves during an ad campaign do not isolate either audience’s response.
6. Decide whether to hold, change, or reduce spend
An algorithmic drop can make the same ad campaign look twice as expensive overnight, even if nothing changed in the ads.
Illustrative example: you spend $140 a week. Total streams fall from 10,000 to 5,000 because Radio declines. Spend divided by total streams rises from $0.014 to $0.028.
That figure divides ad spend by all streams, including plays that did not come straight from your ads. It does not prove the cost of gaining a listener through ads doubled.
Before changing budget, separate what the ad platform reports from what Spotify reports. Compare delivery, click cost, and visits with listener counts, active streams, saves, and follows over the same dates. Use both reports to judge the campaign, without assuming you can match each click to a person who streamed.
Use the music analytics guide for broader campaign measurement. Here, decide whether losing that reach changes what you can afford to spend.
| Evidence | Budget decision | What to check next |
|---|---|---|
| Ad delivery holds, listener response holds, algorithmic sources fall | Hold the planned test budget if its own results still justify the cost | Whether active listening and fan actions hold across another full period |
| Spend holds but fewer people reach Spotify | Inspect ad delivery, links, device paths, and audience changes before scaling | Where the drop occurs between the ad and the song |
| People arrive but saves, follows, and repeat plays also weaken | Test one audience or track change within a capped budget | Whether response improves with that change |
| Music is unavailable or a campaign gap is confirmed | Fix delivery or settings first | Whether the affected songs and sources resume |
| More spend is the only thing keeping total streams flat | Separate replacement traffic from recovery | Whether the added reach is worth its cost on its own |
Set a limit while the cause is unclear
Write a decision your team can revisit:
Keep spend at [amount] until [review date]. Track [lost source] separately. Continue only if [listener result] still earns the cost. If the source stays low, we will [hold, change, or reduce spend] based on those results.
Choose the limit from your past costs and goals, without counting on an algorithmic rebound. Use the music promotion budget calculator to set that boundary.
Steady active streams can still hide a loss
In the source report, “active” means someone chose to play your music. It does not mean they were already a fan. New listeners from promotion can add plays while older listeners fade.
If active streams hold only after you raise spend, check new and returning audience trends before calling demand stable. Keep the audience segments guide beside the source report.
Find the song and audience worth backing next
Once you have checked delivery and reporting, review where new listeners come from. If one source supplied most of your discovery, you need another way to reach people who are likely to want the music again.
Start with a song and listener match, not a bigger stream target. Use your sound, similar artists, current listener patterns, and catalog to choose a small test. Test “fans of mellow guitar pop hearing the acoustic track” and you can judge a specific pairing. “More music fans” leaves both the song and the audience unclear.
Your newest single may not be the best first song for every group. An older, faster track could introduce one audience to the artist, while a quieter song fits another. Test those pairings separately before deciding that the whole catalog needs more budget.
| Choice | What to learn | How it changes the next move |
|---|---|---|
| Which song meets which audience? | Where listening, saves, and follows improve during a defined test | Keep the pairing worth testing again |
| How does someone reach the song? | Whether a mobile tap opens the intended track without extra steps | Fix a broken or confusing route before buying more visits |
| Where should the next budget go? | Which tests still justify their cost after more than one good day | Shift spend toward the stronger response and review again |
Do not choose a song and audience on click cost alone. Check the audience and delivery reports beside Spotify for Artists, using the same dates. If you cannot tie a save or follow to one audience, note that. Do not credit a campaign just because it ran at the same time.
When planning Spotify promotion, decide who hears which song, how they reach it, and how you will use their response to choose the next test.
Keep a short record: song, audience, route, spend, dates, response, next decision. Use it to choose the next test without paying to repeat what you have already learned.
Check for an account or delivery problem
Look for a notice from Spotify or your distributor. Check whether the songs still play in the countries that lost streams, and whether past stream totals changed. Note any missing tracks, country limits, or changes to past counts in your support request.
Spotify’s artificial streaming guidance explains count corrections and distributor involvement. Start there if old streams were removed or you received a warning.
For AI questions, read the AI Persona policy. The badge concerns an AI generated, photorealistic human identity. A real artist using AI tools, or a fictional character that does not look like a real person, is a separate case. Spotify limits recommendations for AI Persona music unless listeners choose to engage with that artist. If your badge looks wrong, use the appeal steps in your account.
A Reddit thread full of similar drops is worth reading for clues. You still need to check whether those artists lost the same sources, on the same dates, as you.
7. Send support a problem they can check
If several tracks lose the same source overnight, or the drop starts when you move distributors, send the comparison you built above.
Ask your distributor about delivery, track linking, and campaigns they manage. Ask Spotify for Artists about account notices and missing or late stats.
Copy this outline and fill it in:
Artist and track links: [links]
First affected UTC date: [date]
Comparison periods: [complete dates before and after]
Affected sources and counts: [source, before, after]
Other tracks checked: [links and whether they changed]
Active streams: [before and after]
Recent changes: [campaign, distributor, release, or none known]
Evidence attached: [dated screenshots and relevant notices]
Request: Please check for a reporting, delivery, or account eligibility issue affecting these tracks. If another team must review this, please route the case and confirm which details they need.
Keep the case number and add new evidence to that thread. If you get a broad reply about promoting your music, ask which tracks and dates they checked. Point them back to the source that changed.
8. Define recovery before the total starts climbing
Track three things separately: the source you lost, active listening, and paid spend. Put your normal pre-drop range beside each.
| What improves | What you can conclude |
|---|---|
| Total streams rise after a budget increase; Radio stays low | You bought or attracted replacement reach. Radio has not recovered |
| Radio returns across the affected songs with spend steady | Recommendation traffic has recovered during that period; the cause still needs evidence |
| Radio stays low, but active listening and fan actions improve at a sustainable cost | You may be building a stronger audience despite lower algorithmic reach |
| One day spikes, then falls back | Too early to treat that day as a new baseline |
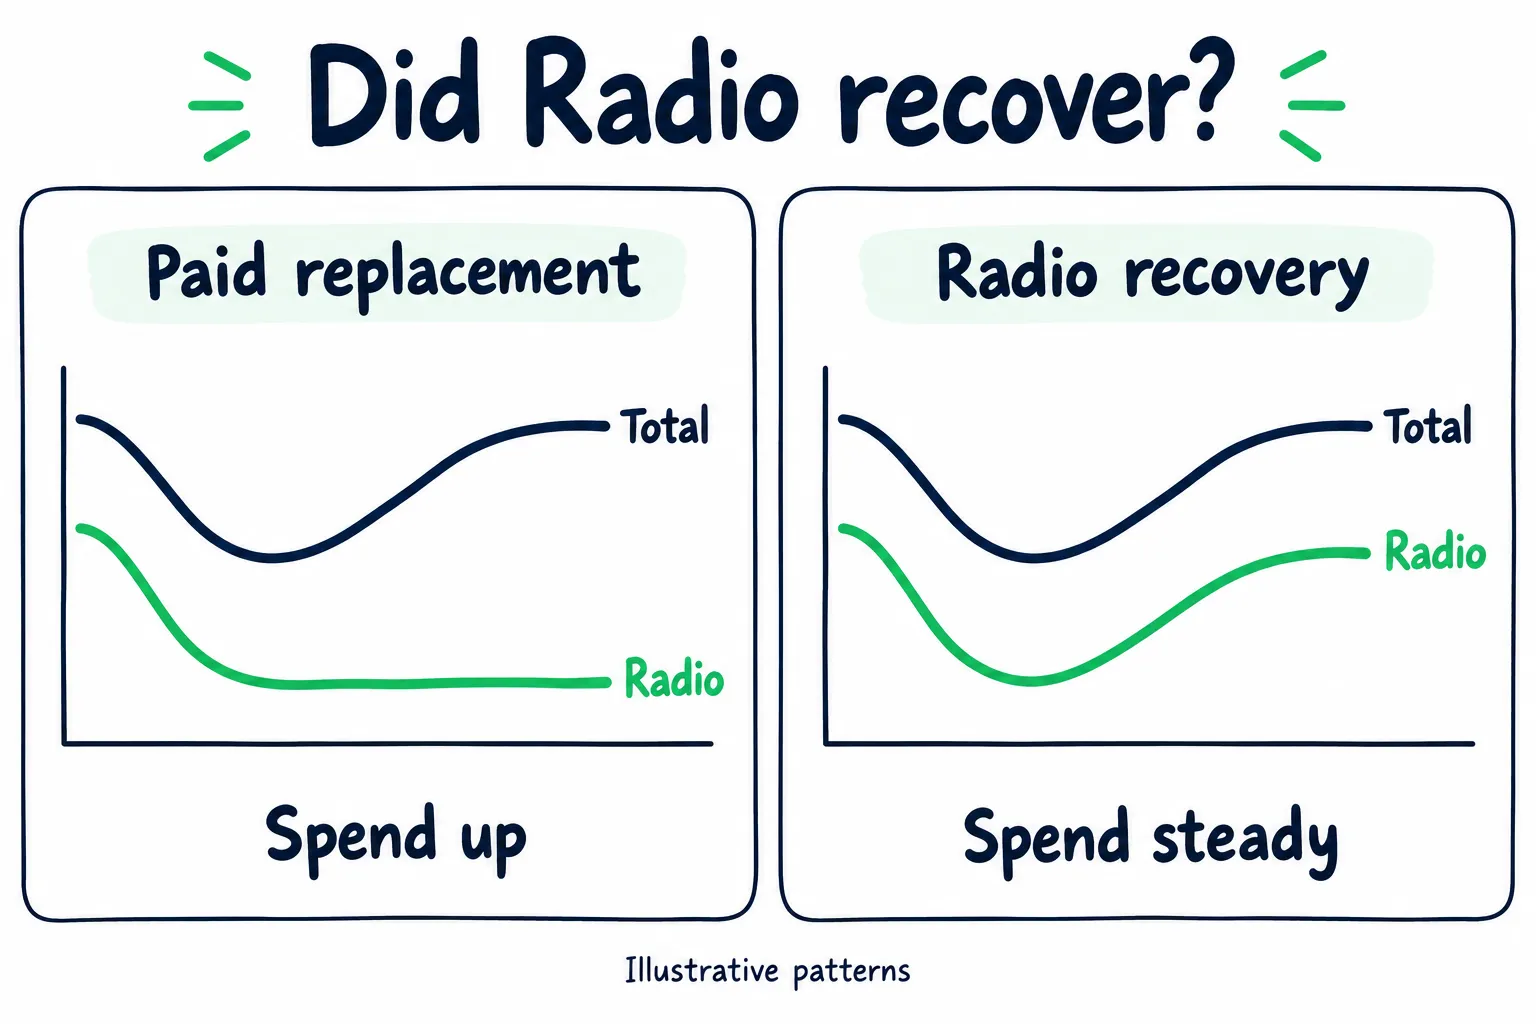
Both totals rebound. Only the right example shows Radio recovering. These are illustrative patterns, not account data.
Use the same review window you started with. A full week is a practical checkpoint, not a Spotify rule. For low-volume songs or a new release, you may need more time and a wider range.
Keep each change dated. That lets you see whether the lost source returned before the fix, after it, or only while you paid for more reach.
Also keep the song and audience matches that held up during the drop. They give your next release a tested starting point.
FAQ
Why did my Spotify streams drop overnight?
Separate fewer new plays from removed past plays. If yesterday’s total is low, check whether reporting has finished. If several complete days are down, find which sources and tracks lost traffic. A campaign ending, a playlist change, or less recommendation traffic can each leave a different pattern.
If older public totals shrink, check distributor notices and stream corrections. An overnight drop alone does not prove a penalty or an algorithm update. Save the before and after counts before changing promotion.
What time of day do Spotify streams update?
Spotify for Artists updates daily at approximately 8 PM UTC. It also uses UTC to define each reporting day, which may differ from your local date.
New releases have a separate live stream count for their first seven days. That live count updates about every two seconds. Its ending does not mean Spotify stopped recommending the track. Compare fully updated daily reports, then recheck the same dates after the next update to see whether missing numbers filled in.
Why did my Spotify Radio streams drop even though my save rate is high?
A strong save rate does not guarantee the same reach. It describes the people who heard the song, and that group may have changed. If broad discovery falls while existing fans keep listening, your save rate can rise as total listeners and saves fall.
Compare saves and listeners for the same song and dates. Then check which sources lost plays. Saves earned while ads run do not show how Radio listeners alone responded, so avoid treating your total save rate as a score for that source.
Why are my streams falling while Discovery Mode is still active?
Check each song’s campaign status and results. Confirm that the affected tracks remained selected, especially after a distributor move. Then compare Radio, Autoplay, and eligible Mixes with sources outside Discovery Mode.
Read current campaign lift separately from historical lift. Historical lift compares with the period before the song’s first campaign, so it can stay positive while recent streams fall. For saves and intent rate, give each period the same follow-up time, because Spotify counts those actions for 14 days after each listener’s first campaign exposure.
How long does it take for Spotify algorithmic streams to recover?
There is no fixed recovery time. For a late report, recheck the same dates. For a campaign gap, confirm when delivery resumed. If neither explains the loss, track the affected source against its earlier range while support checks the evidence.
Keep spend visible beside that source. If extra ads bring total streams back up while Radio stays low, you have replaced traffic rather than recovered Radio. Judge that spend by the listener response it earns, with a budget limit and review date, instead of waiting for a promised algorithm reset.